Real Estate vs. the S&P 500: How Prices and Returns Compare Nationally and in Boston
A case study into whether the opportunity cost of homeownership even makes sense.


As a very naturally data-driven person, I have a habit of spending a little too long on the analysis which often hampers the "doing". This time, I'm making a concerted effort to dive straight into the home-buying journey. Taking action given imperfect information.
This is my effort to square the opportunity of real estate against my preferred wealth-building vehicle, the stock market to make sure I have good priors.
Real Estate Prices: National Trends
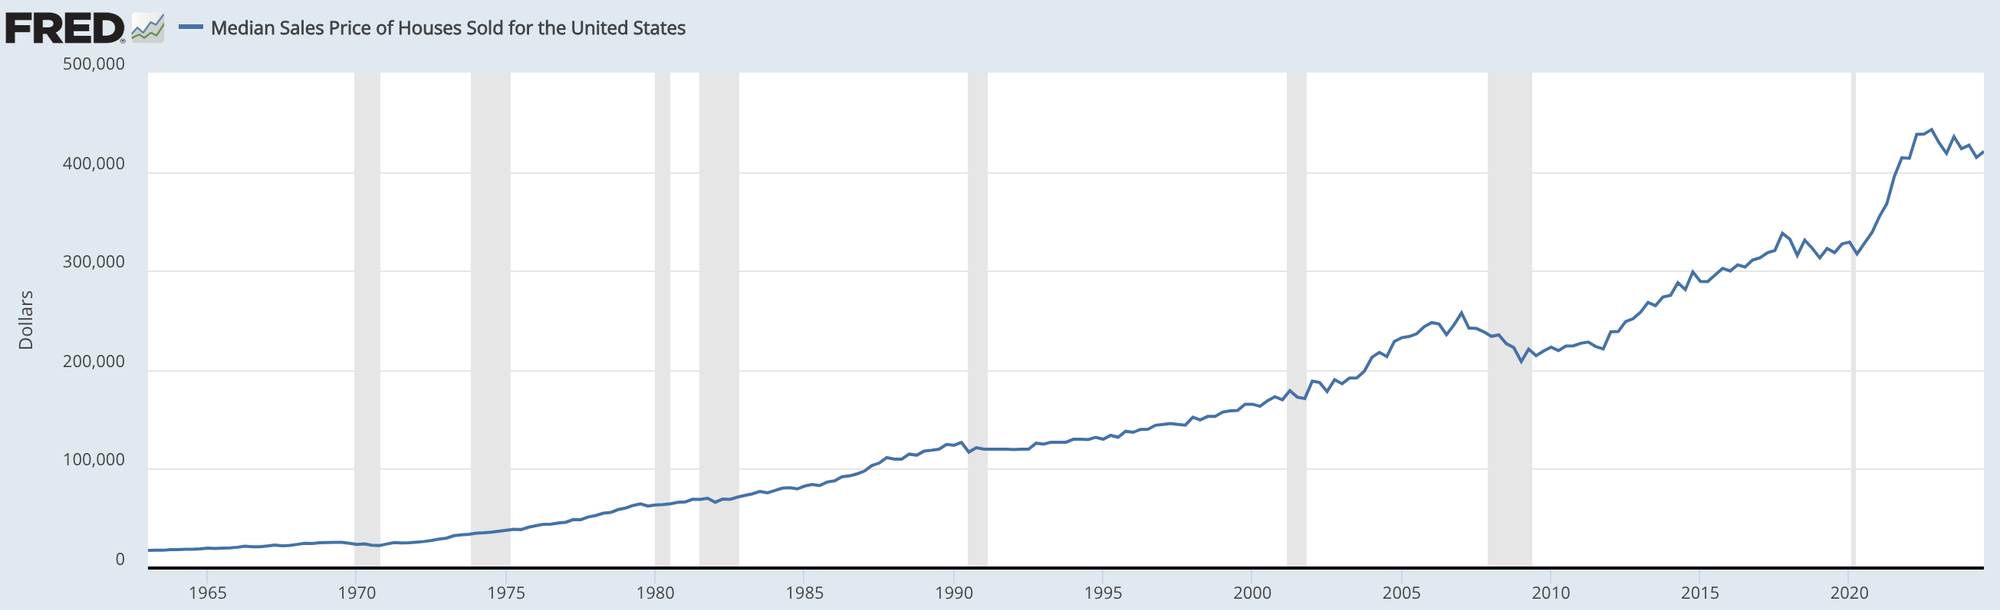
National home prices have seen steady growth over the last 50+ years, but the story changes when you adjust for inflation.
- Long-Term Growth: Since 1970, home prices have appreciated at an average annual rate of 5.4% nominally, according to the Case-Shiller Index and Freddie Mac.
- Inflation-Adjusted: Real appreciation—after accounting for inflation—drops to ~1.5-2% annually. Real estate’s value tracks inflation closely, plus a small premium. (Case-Shiller Index, in2013dollars).
- Post-2008 Recovery: Home prices rebounded strongly after the financial crisis, rising 60-70% from 2012 to 2023. (FHFA)
Key Drivers:
- Population growth and rising household formation.
- A housing supply shortage exacerbated by slow new construction.
- Low mortgage rates post-2008 (until 2022).
This sets a good prior baseline which helps me trust that real estate in general rises over time, which is common knowledge.
Boston Real Estate: Outpacing the Nation
Boston has consistently outperformed national trends, driven by strong demand, a constrained supply, and economic strength.
- Long-Term Appreciation: Since the 1980s, Boston’s housing market has appreciated at an average rate of 6-7% annually. (NeighborhoodScout).
- Recent Trends: Over the past decade, Boston home prices nearly doubled, rising from a median of $350K in 2012 to ~$700K in 2023. In some neighborhoods, appreciation has been even stronger. (Redfin).
- Current Prices: The average home price in Boston hit $840,000 in 2024, with a recent year-over-year increase of 5.1%.
Why Boston Outperforms:
- Thriving education, healthcare, and biotech sectors.
- High demand for housing amid limited land and restrictive zoning.
This improves my baseline. When it comes to financial data, historical data often does not predict the future but recent trends often do serve as a useful data point especially when supported by fundamentals like constrained housing supply and upsides of its various industries.
Returns: Real Estate vs. the S&P 500
The S&P 500 has historically outperformed real estate in nominal returns, but leverage tilts the scales for property investors.
- S&P 500: Since 1950, the S&P 500 has delivered average annualized returns of ~10.26% nominally (~7% after inflation). (Investopedia). However, there have been many years when prices plunged.
- National Real Estate: Historically, housing appreciated at 5.4% annually (~1.5-2% real growth). (Case-Shiller). Similarly to stocks, there have been many cycles like during the '08 crisis when housing prices did collapse.
Long-term, both of these assets have always worked out so far...
The Power of Leverage in Real Estate
Unlike stocks, real estate investors rarely buy properties outright, using leverage (debt) to amplify returns.
Example:
- Purchase a $500,000 property with a 20% down payment ($100,000).
- If the property appreciates 5% in a year, that’s a gain of $25,000—a 25% return on your cash invested.
However, leverage works both ways:
- A small decline in prices can magnify losses.
- Costs like interest, taxes, and maintenance eat into returns.
Which Investment Wins?
- S&P 500: Wins for long-term growth, liquidity, and passive investing.
- Real Estate: Offers amplified returns through leverage, stability, tax advantages, and the utility of a tangible asset.
Note, stocks can be leveraged as well to magnify gains. One of my favorites that I do not recommend for the average investor due to a whole host of risks like leveraged losses, high expense fees, and beta decay is TQQQ (3x NASDAQ packaged into an easy-to-use ETF).
In cities like Boston, where appreciation combines with strong rental income, real estate can hold its own against stocks—especially for leveraged investors.
Key Takeaways
- Nationally, real estate has grown at 5.4% annually (1.5-2% real).
- Boston real estate has outperformed at 6-7% annually since the 1980s.
- The S&P 500 still beats real estate in long-term returns (~10% annualized), but leverage can make property investments competitive.
My current plan calls for leveraging up to buy real estate at 3.5-5% down. Let's add 2% with closing costs (so 5.5-7% down) to be conservative and assume the monthly mortgage will be approximately breakeven after everything is accounted for. This is a 14-18x leverage on call it 4% growth in Boston (an underestimate) for a first-year simplified estimate of 50-70% ROI. Not bad.
Sources: